Motivation
Main reason for writing this blog-post is the extremely crappy article by Vallejo named "Installation and First Contact With the New WinDbg". I read it, cried for a few minutes and decided to fix it.
Mandatory XKCD reference:

Having said that, let's go through some of the most "brilliant" Vallejo's statements!
Installation
We execute WinDbg from installation shortcut and we search the main process.
Dude, when your article is called "Installation and first steps..." shouldn't you start at the beginning and tell us where to get this app and how to install it?
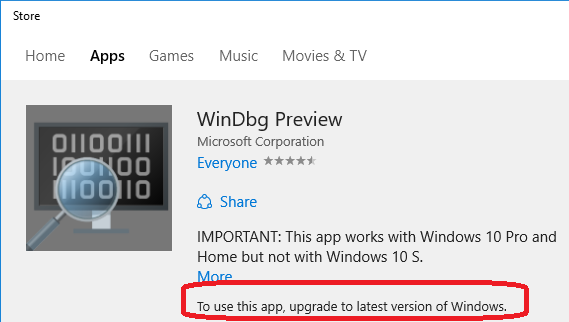
You need to get the app from the Windows Store: https://www.microsoft.com/store/apps/9pgjgd53tn86.
No, there is no real technical reason for that, just another attempt of Microsoft to convert you to Windows 10 and make you use their Windows Store.
To make matters worse, you need to have installed the latest and greatest update of Windows 10 to do that. There is no technical reason for that, either.
After you've jumped through all those hoops, you get this nice and shiny Windows Store app. Windows Store apps get installed under "C:\Program Files\WindowsApps\" and this one is no different. At the moment of writing the application version was 1.0.16, so it got installed into "C:\Program Files\WindowsApps\Microsoft.WinDbg_1.0.16.0_x86__8wekyb3d8bbwe".
Reparse point
The installation creates another exe here: C:\Users\<user>\AppData\Local\Microsoft\WindowsApps\WinDbgX.exe. It is zero bytes, and if you try, for example, to copy it, you can’t.
Because it's a reparse point, not an EXE file.
Windows 10 processes bundled Windows Store application's AppxManifest.xml and creates appropriate appExecutionAlias'es:
              .run
              .dmp
              .mdmp
              .hdmp
              .kdmp
              .ndmp
Same thing goes for all other applications Vallejo "found" under C:\Users\<user>\AppData\Local\Microsoft\WindowsApps\, like dbgsrv64.exe:
You can read more about aliases on MSDN: Start your app by using an alias.
Fsutil
I have not found a tool or way to manage or get information about these files.
Ever tried fsutil? It's been part of Windows since Windows7.. 😀
Here's output of fsutil reparsepoint query WinDbgX.exe:
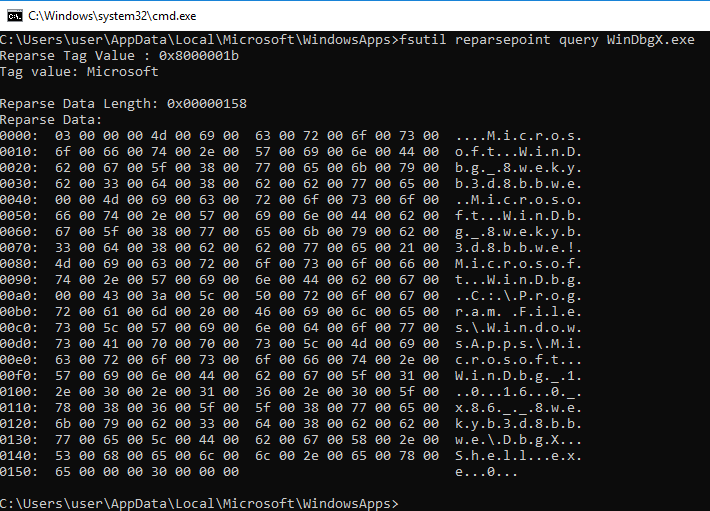
As you can see, it's a reparse point with a tag 0x8000001b (IO_REPARSE_TAG_APPEXECLINK).
Sure, you can Google for that - but it won't tell you much, except that it's not really documented and should be left alone.
Command-line
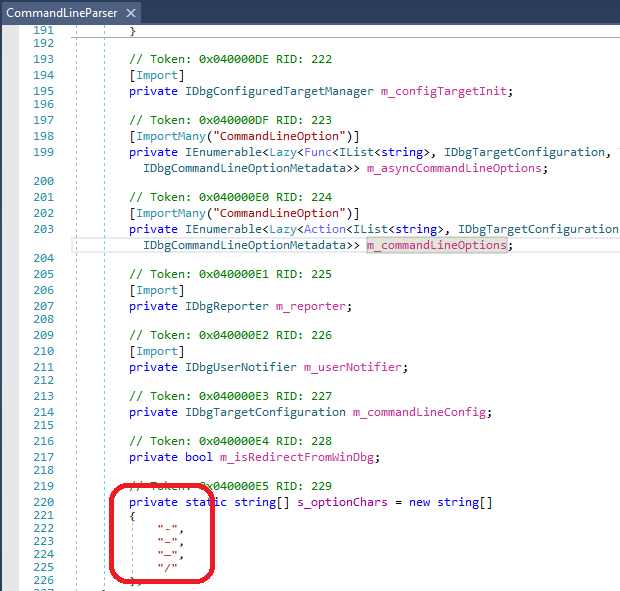
Old windbg.exe accepted parameters with “-“, for example -k. New Windbg needs /k parameter to pass the connection configuration
Bullshit! In fact, WinDbgX accepts any of 4 different delimiters: "-", "–", "—", "/" and combinations of those..
Ok, that was enough criticism for one day. Let's do something more constructive!
Running WinDbgX on Windows 7
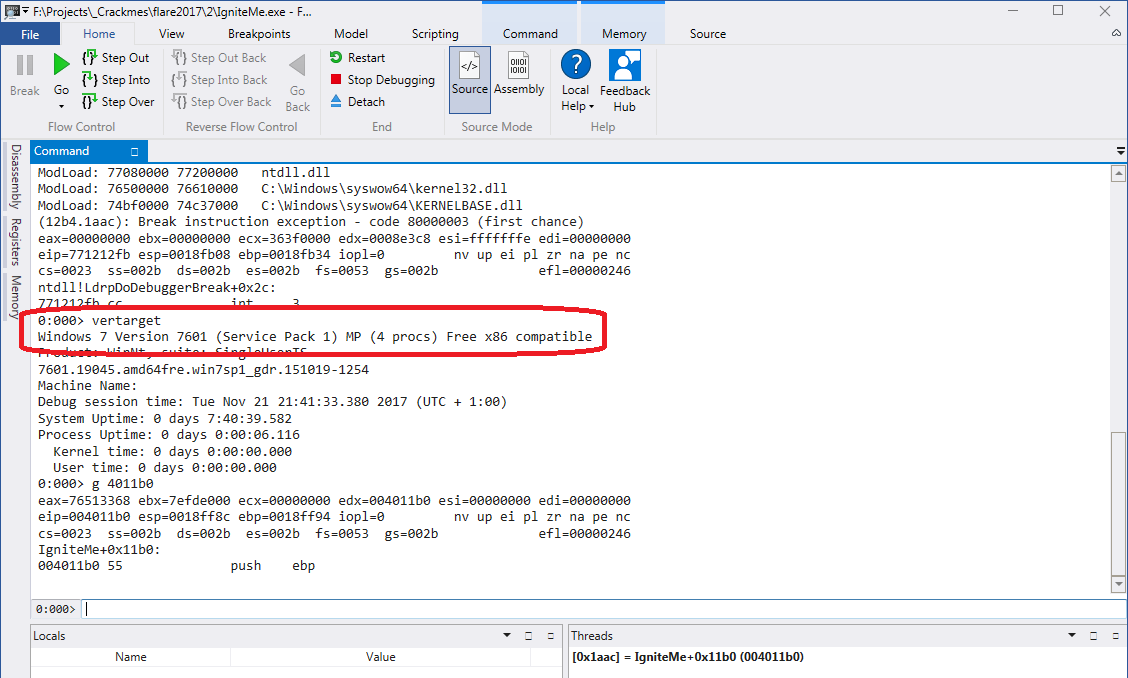
Remember how I said that there is no technical reason why WinDbgX should be available only on Windows 10 and only as a store app? There really isn't. 🙂
Here's WinDbgX running on my Windows 7 and debugging one of the FLARE2017 crackmes:
It's actually a really simple fix.
- You need to copy all the files from your Windows 10 machine to your other machine (Windows 7 in my case). It's as simple as selecting all files in "C:\Program Files\WindowsApps\Microsoft.WinDbg_1.0.16.0_x86__8wekyb3d8bbwe" and copy-pasting them. Don't worry about the reparse points in C:\Users\<user>\AppData\Local\Microsoft\WindowsApps\, we'll fix that later.
- If you try to run DbgX.Shell.exe on Windows 7, it will fail with Exception:
***FATAL ERROR ENCOUNTERED***
2017-11-21:20:01:12:504 : Error : DbgX.dll : (E) System.TypeLoadException: Could not find Windows Runtime type 'Windows.ApplicationModel.Package'. ---> System.PlatformNotSupportedException: Operation is not supported on this platform.
   --- End of inner exception stack trace ---
   at DbgX.DbgEngModule.SetDbgSrvOverridePathIfNeeded(Boolean use64Bit)
   at DbgX.DbgEngModule.DebugCreateOutOfProc(Boolean use64BitDebugger, Boolean shouldElevate)
   at DbgX.EngineThread.ThreadProc()
System.TypeLoadException: Could not find Windows Runtime type 'Windows.ApplicationModel.Package'. ---> System.PlatformNotSupportedException: Operation is not supported on this platform.
   --- End of inner exception stack trace ---
   at DbgX.DbgEngModule.SetDbgSrvOverridePathIfNeeded(Boolean use64Bit)
   at DbgX.DbgEngModule.DebugCreateOutOfProc(Boolean use64BitDebugger, Boolean shouldElevate)
   at DbgX.EngineThread.ThreadProc()
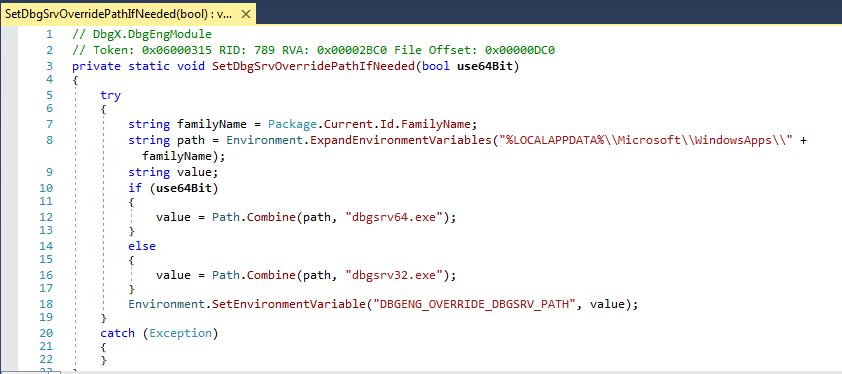
- Let's look at that code in DbgX.dll using dnSpy:

It's crashing on the Package.Current.Id.FamilyName, as this function is available only for Windows Store apps.As a simple hack, we can replace this call with an empty string. Better hack would be to use the proper folder based on the actual WinDbgX path. But the simple way will do for our demo..
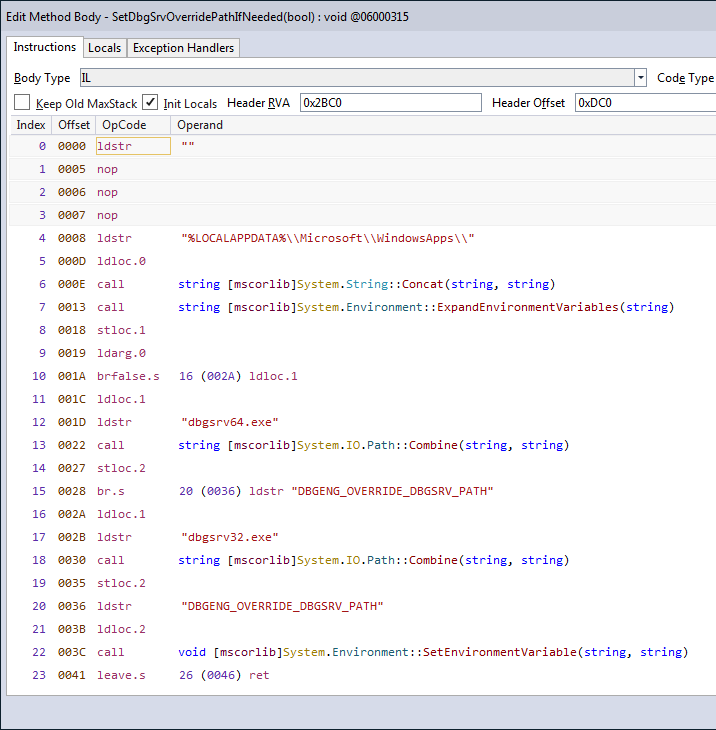
- Using "Edit IL instructions" function in dnSpy, replace first 4 instructions with ldstr and nops:

- Save the module. If saving fails, remove read-only attribute from DbgX.dll and try again.
- Since we chose a simple hack, create folder C:\Users\<user>\AppData\Local\Microsoft\WindowsApps\
- Depending on your OS (32- or 64-bit), copy files from WinDbgX\X86 or WinDbgX\amd64 folder to C:\Users\<user>\AppData\Local\Microsoft\WindowsApps\. Rename dbgsrv.exe to dbgsrv32.exe or dbgsrv64.exe accordingly.
- Run the DbgX.Shell.exe shell now. It will work just fine!
There are 3 more places in DbgXUI.dll, DbgX.Util.dll and Extensions\DbgX.External.dll that might need similar fixes. But that's behind the scope of this article.
Conclusion
It is true that classic WinDbg looks really dated. So, I can totally understand why Microsoft would want to create a replacement with a better UI. However, WinDbgX falls short on everything - its installation via Windows Store is brain-dead stupid, its user interface is confusing (who would look at Model->Change Query to change debugger settings?!) and severely limited (no multiple Memory windows, seriously?). If it was a school project, it wouldn't get even a B-. But for some reason, Microsoft insists that this is the only way forward. Oh, well.. 🙁
At least, the DLLs are not obfuscated, so someone can take them and make a much better UI.. 😉
Have fun!
kao.